Complete guide to Prescriptive Customer Analytics (2026)

Áp dụng suy nghĩ chiến lược về nghề nghiệp
1 July, 2026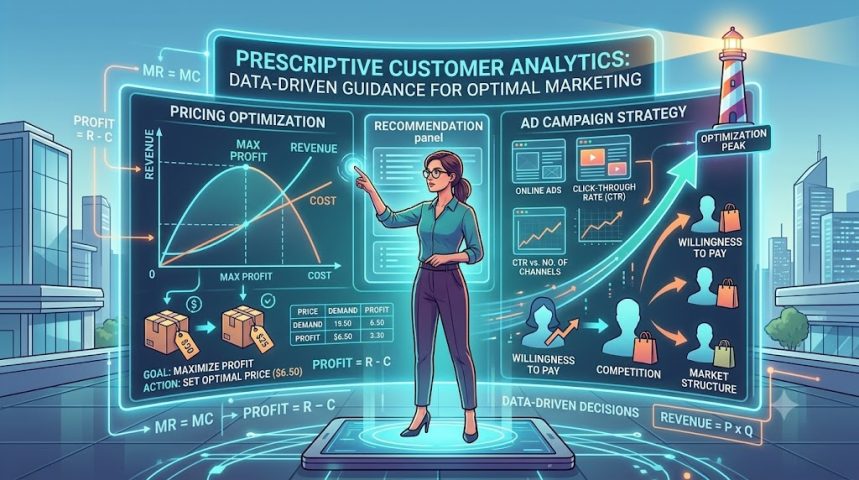
Last updated on 1 July, 2026
Prescriptive customer analytics is the process of using data to provide a recommendation on what actions a business should take to achieve a specific objective goal. By defining clear goals, understanding available actions, and building accurate models, companies can optimize everything from product pricing to online advertising strategies.
What is Prescriptive Customer Analytics?
Understanding data requires different analytical approaches. First, descriptive analytics collects and analyzes data to map and understand patterns. Next, predictive analytics uses customer data to predict what they will do in the future.
However, the final step is prescription. Prescriptive customer analytics provides a recommendation, or a “prescription,” on what exact actions to take to achieve a goal. To successfully solve a problem using this method, you need three elements:
-
A set of goals you want to achieve.
-
A set of actions you can take to achieve that goal.
-
A model that describes how your actions impact the goal.
How to Define Goals and Actions in Analytics?
Before running any optimization, you must define the problem. Let us look at a simple retail example.
Suppose your goal is to maximize the quantity of a product sold. The action you can take is to change the price to encourage consumers to buy.
If you look at a descriptive demand curve, you can see how quantity is impacted by price. To sell the maximum possible quantity, the model shows that you would need to set the price to zero, essentially giving the product away for free. While this achieves the goal of maximizing quantity, businesses usually want to generate revenue.
How Can You Maximize Revenue Using Data?
If your goal changes from maximizing quantity to maximizing revenue, your model must change. When setting a price to maximize revenue, there are two opposing forces in operation:
-
When the price is decreased, the quantity sold is higher, but the revenue for each item sold is lower.
-
When the price is increased, you make more money for each item sold, but you sell fewer items.
This dynamic is called a tradeoff. Identifying this tradeoff beforehand helps you understand exactly what you are looking to solve. To find the maximum revenue, you must map the revenue graph and locate the peak price point before revenue starts dropping again.
What is Profit Maximization in Analytics?
In many cases, a firm is not solely interested in maximizing its revenues. A business wants to ensure that after paying for the cost of production, it still has money left in the bank.
Therefore, you must take into consideration the cost of producing the items. Your new goal is to maximize profit, which means maximizing revenues minus costs.
The MR=MC Rule
How do you find the exact best price for profit? The process of optimization tries to increase the price until there is no additional gain in profit.
-
You look for the exact point where the change in revenue equals the change in cost.
-
The change in revenue is called “marginal revenue” (MR).
-
The change in cost is called “marginal cost” (MC).
Therefore, the optimal price is found when MR = MC.
How Does Market Structure Affect Pricing?
Market structure is a critical part of your prescriptive model. It answers questions such as “who else is also active in my market” and helps determine how your actions affect outcomes.
For example, you must consider Willingness to Pay (WTP). Willingness to pay is the maximum amount a consumer would pay for an additional item. By calculating the sum of a consumer’s WTP, a business can offer an “Optimal Bundle” of items that generates significantly more profit than selling single items at a fixed price.
Furthermore, you must account for competition. If you lower a price to increase profit, your competitor might do the same. This strategic interaction is analyzed using game theory.
How Do You Apply Analytics to Online Advertising?
Prescriptive customer analytics is heavily used in digital marketing. When running an online advertising campaign, companies must choose where to show their ads, such as on Facebook, Google, or Bing.
Because it is difficult to calculate the exact profit from a single consumer, many advertisers use the “click-through-rate” (CTR) metric. This measures what percentage of the people exposed to an ad actually clicked on it.
Avoiding Causal Mistakes
If data shows that exposing consumers to ads on multiple different networks leads to a higher CTR, you might conclude that more ad channels equal more clicks.
However, this can be an incorrect conclusion. Because networks are judged by the CTR they achieve, ad networks can simply choose to expose ads only to consumers who are likely to click anyway. This is a prime example of mistaking correlation for causation.
Prescriptive Strategy Summary Table
| Element | Description in Analytics | Business Example |
|---|---|---|
| Goal | The objective you want to achieve. |
Maximize profit (Revenues minus costs). |
| Action | The steps you take to reach the goal. |
Changing the price of a product. |
| Model | How actions impact the goal. |
Using the MR=MC rule. |
| Market | External forces affecting outcomes. |
Competitor pricing and consumer WTP. |
Conclusion
To succeed in today’s market, using descriptive data is not enough. You must use prescriptive customer analytics to find the optimal actions for different goals. Whether you want to drop your price to maximize quantity, use the MR=MC rule to maximize profit, or evaluate ad networks, you must build careful models. Always remember to ask the right questions and avoid mistaking correlation for causation in your data.
For more relevant content: